Use Wufoo integrations and get your data to your favorite apps.

Category: analytics

There are 7 posts published under analytics.

Productivity CliffsNotes: What I Learned From Tim Ferriss

When you’re starting up a new venture, it’s easy to become overwhelmed. Sometimes, it seems as though your startup is running you, not the other way around.

For me, this meant spending too many hours a week working where I wasn’t needed. Tim Ferriss’s book, “The 4-Hour Workweek,” hit me in the right place at the right time and helped me become an efficient leader (instead of an exhausted one).

If this is the first time you’re hearing the name Tim Ferriss, chances are it won’t be the last. A successful startup founder in his own right and a prolific angel investor, Tim’s biggest success comes from his skill at lifestyle design: managing your life to be your most productive without losing sight of your priorities.

After he founded his nutritional supplement company, BrainQUICKEN, Tim Ferriss went on to write “The 4-Hour Workweek,” which became an enormous success in the Silicon Valley tech scene. Like many startup founders, Tim had been running himself ragged, devoting nearly all his time to running his company.

It was only when he reevaluated where he was actually needed that he began to realize that more did not necessarily equal better. I took the lessons in this book to heart and still use many of the techniques he evangelizes today.

What I Learned From Tim Ferriss (and How It Can Help You)

The law of the “vital few and trivial many” is a recurring theme in “The 4-Hour Workweek,” and it’s the jumping-off point to changing how you do business.

Ferriss uses what is known as the Pareto Principle, or the 80/20 rule. As used in Ferriss’s book, the 80/20 principle means that 80 percent of your output is a result of only 20 percent of your input. In other words, 80 percent of your efforts are misguided or wasted; it’s the vital 20 percent you should be focusing your energy on.

The 80/20 principle isn’t about cutting corners or working less, but working smarter. It taught me to analyze where I was most useful and concentrate my efforts there, freeing up the rest of my time to recharge or work on other things.

There are a few practical ways to discard your wasted “80 percent” activities so you can achieve real productivity.

1. Manage by Absence

This might be the hardest thing for a startup founder to do, but it’s also the most important. Step away from managing things for a while, and see what starts to fall apart. It sounds dramatic, but the fact is that once you’ve set the wheels in motion, many aspects of the business can run on a daily basis without your oversight. When you can see what those things are, you can put your efforts to better use.

2. Interrupt Interruption  

Another thing that prevents you from achieving 80/20 is the sheer amount of distraction in everyday life. The habit of constantly checking the news or social media, refreshing your inbox multiple times per hour, and trying to keep up with the flow of information online can trick you into feeling productive without actually getting anything done.

In the “The 4-Hour Workweek,” Tim discusses going on a low-information diet where you essentially tune out news and time-sucking distractions altogether. To keep yourself off social media and other time-wasters online, try StayFocusd for Chrome or LeechBlock for Firefox.

Stop answering the phone, and direct calls to your email. To avoid becoming a slave to your inbox, use a tool like SaneBox or Mailbox to categorize your emails and have them reappear automatically if you need a reminder.

3. Don’t Be Afraid to Outsource

Outsourcing can be a dirty word, and, in some situations, it’s warranted. But outsourcing doesn’t just refer to manufacturing and customer support. In this context, it’s more about delegating. It’s easy to find skilled freelancers and virtual assistants online who can do basic tasks at a lower cost. (Tim even outsourced his online dating.)

While this is an extreme example, eliminating the busywork from your life — and from your key employees’ lives — means you can increase your efficiency and allow everyone to focus on the most important things.

4. Get Analytical

Part of what makes Tim brilliant is that he’s all about experimentation. He’s a scientist of business, writing, cooking, and exercise to find the most efficient way to do things. Think of it as A/B testing your life and making small changes that have a big cumulative effect on the way you manage your time.

The underlying lesson I took from “The 4-Hour Workweek” is the notion that you can define your own reality. It’s not just about having goals; it’s about going back to the beginning and figuring out the steps that will take you where you want to go.

For me, utilizing the 80/20 principle allowed me to go from working on one startup 40-50 hours per week to working 12 hours a week. Not only did I work more efficiently, but I used the extra time to start another company with profits that were 10 times that of the business I’d been spending the whole week on.

Spending time where you’re most needed and cutting out everything else can open up a world of possibilities for you. You just have to be willing to step back and unabashedly change your daily reality.


Stephan Aarstol is the CEO and founder of Tower Paddle Boards, an online, manufacturer-direct brand in stand up paddle boarding. Tower Paddle Boards was invested in by Mark Cuban on ABC’s “Shark Tank,” was named one of the show’s “Top 10 Success Stories” by Entrepreneur Magazine, and was featured by People Magazine as one of “Shark Tank’s Biggest Winners.” Stephan is an entrepreneurial thought leader and online marketing expert, and he welcomes anyone to reach out to him on Google+.

2865

Five Questions to Ask a Mobile App Analytics Company

‘Tis season for growing mobile commerce. Black Friday and Cyber Monday reports from retailers are showing massive growth in purchases from cell phones.


To improve performance, internet retailers can never get enough information about customer behavior. So in the post-holiday season, many etailers will choose to revisit mobile analytics to improve their data capture and quality. Dozens of mobile analytics companies will tell you why they are the best. It’s confusing to judge. That said, there are some simple questions which can quickly screen out the analytics companies that you probably don’t want to do business with. Here are five things to ask the sales rep.


1) What is your business model? And what are your potential conflicts of interest?


A number of mobile analytics companies are actually subsidiaries or business lines of mobile advertising providers that sell ad or retargeting inventory. This is a clear conflict of interest. Insights taken from analytics will drive key marketing and advertising spend decisions.  If the same company that sells you the analytics tools also wants to sell you advertisements or marketing services, how can you trust their analytics data?  Even if the analytics data remains pristine, just dealing with constant upsells is a hassle.


The Best Answer: “We only sell analytics capabilities. Our only revenue stream is selling analytics tools.”


2) Can I see the source code of your SDK and can I compile it myself?

Every mobile analytics company needs to install a Software Development Kit in your application. Engineers hate this. So to improve your chances of convincing your engineers to install new analytics (or to argue with them to remove your existing system) ask this simple question: “Can I see the source code of your SDK?” If you can’t see the SDK source code, then you don’t really know what the analytics company is doing with your customer data. You also can’t see how the SDK is interacting with your app. A black box SDK could be accessing key customer data (geolocations, purchase patterns etc.) without telling you about it. Or that SDK may be forcing all functions in your app to wait while it completes calls to the server, leading to slower app response times. If you never saw the code, you would have no way of knowing that the SDK was doing these things. Also, a poorly written SDK may crash your app or conflict with other third-party SDKs. For app developers and publishers, the best case is if your analytics company has an open source SDK. Your engineers can not only see the code, but also request modifications if the code is published in GitHub or Bitbucket. If the analytics company allows you to review the SDK source code and compile it on your own, that’s also good and might be an acceptable alternative. But then you will need to see the code every time the analytics company makes modifications in order to be completely sure that the SDK is not going to cause problems.


The Best Answer: “You can actually download our SDK source code or even modify it. Our SDK is open source. Here’s the link.”


3) Is all tracked information transmitted over an encrypted connection?

This is one of the dirty little secrets of mobile analytics. The majority of the tracked information transmitted from the user’s smartphone back to the analytics provider is sent as clear text. As a result, geolocation data and most other personal information is often sent out unencrypted. Most publishers have no idea that this is happening. Unfortunately, not encrypting all traffic between the handset and the tracking server presents an enormous potential risk for an app developer. It might also be a privacy law violation in many European countries that could get you fined. Don’t take my word for it. Read what the Privacy Rights Clearinghouse has to say on the topic of privacy and encryption for mobile applications.


Why would mobile analytics providers put their customers at risk? Money. Maintaining robust, end-to-end encryption is expensive. The process is far more compute intensive and sucks up more bandwidth than just sending most tracking data in clear text. To encrypt all analytics traffic coming off the app, the analytics providers would need to purchase an appliance designed for encrypted connectivity. Or they would need to reserve a dedicated cloud server that specializes in what’s called SSL termination (SSL is the most common form of encryption on the Internet). Either can cost well into the six figures per year. Encryption also means sending more bits over the wire. That means more bandwidth is used. Using more bandwidth, particularly for cloud-based mobile analytics SaaS companies, can significantly increase costs because cloud providers nail you on bandwidth costs. So to save money, analytics companies cut that corner. But don’t settle on this one. Ask for end-to-end encryption.


The Best Answer: “100% of analytics tracking information from your customers to our services is encrypted.”


4) Where do you store the tracking data? Do you have physical control of the servers?


Sound paranoid? Maybe. But for any sort of true compliance with privacy standards, an app publisher will need to know the physical location of user data. In cloud computing, it is impossible to designate a specific physical location unless the data resides in a specific piece of hardware. If your user data is stored in a giant cloud data center, you may know the street address. But that data may be scattered across a handful of servers and may be moved from one server to another at random. Knowing exactly where your data resides will make your life much easier if you are sued, need to pass a privacy audit, or even want to ensure that all your user data is deleted at regular intervals.


Note: This is a particularly hot topic in Europe. Many European companies, in particular those in Germany, flat out refuse to allow the tracking data gathered from their users to be stored outside of the European Union. Recently, many European companies have started to insist that their data reside in an infrastructure that is not owned by a U.S. cloud provider, such as Amazon Web Services (sorry, AWS Dublin). These European companies fear that the U.S. National Security Agency has full access to their data if a data center is operated by a U.S. cloud provider. So if you are a U.S. publisher planning to distribute and monetize an application in the E.U., you should strongly consider nailing down the physical location of analytics data stored by third-party analytics providers.


The Best Answer: “We control all the servers and hardware we use for data storage. We can even tell you a specific cage location.”


5) Can I easily share my aggregated historical data with marketing partners?


Basically, this question tests the technical capabilities and data export features of your analytics provider. You, as the customer, should be able to easily slice, dice and export your user analytics data into whatever marketing optimization, revenue augmentation, retargeting, or attribution management system. And you should be able to do this, at a minimum, as aggregated data grouped as a time-series so that you can maintain historical continuity even if you switch analytics providers. At the core of this capability must lie a well-structured API offered by your marketing analytics provider. This API should allow you to export specifically selected types of information, using accepted formats such as JSON, XML or CSV, to any destination. If your mobile analytics provider really loves you, they will set your data free when you want to take it back. If not, then you know that there is a serious lock-in problem caused either by their technology or their business model.


The Best Answer: “You can definitely share your aggregated historical data with marketing partners. Just read our API documentation to learn how. If you have specific questions, we’ll you connect with our database engineers.”

344

YEC Answers: 9 Tips for Developing a New Mobile App

Considering how saturated the app market is, what advice would you give to an entrepreneur developing a new mobile app? -CitizenTEKK

The following answers are provided by the Young Entrepreneur Council (YEC), an invite-only organization comprised of the world’s most promising young entrepreneurs. In partnership with Citi, YEC recently launched StartupCollective, a free virtual mentorship program that helps millions of entrepreneurs start and grow businesses.

1. Identify Factors

This one is simple because I am working on my own mobile app now and have been doing a crazy amount of research in this area. Basically, find the sticky factor and the viral factor. What this means is what makes the end user want to come back and add content on a daily (if not more) basis? Then, after they add their content, what makes them want to share that with their network?

Andrew Vest ( https://twitter.com/AndrewVest ), Preferling ( http://www.preferling.com )

Entrepreneur at YEC comments at CitizenTEKK

2. Gather Usage Metrics

Due to the overwhelming amount of mobile apps in the market, it is very important that you analyze your app through metrics. Services such as Mixpanel can be integrated into your app to gather important usage data, which can guide you to the compelling portions of your app. Once you identify how and what your users find value in, you can focus on those and remove underutilized features.

Phil Chen ( https://twitter.com/nethacker ), Givit ( http://www.givit.com )

Entrepreneur guest blogs at CitizenTEKK

3. Deliver Value

In the oversaturated startup and app market, delivering value that users can see, understand and that truly delights is job one. Your app doesn’t have to change your users’ world — but if it makes their live easier or more rich, you may be onto something.

Brendan Mangus ( http://twitter.com/bpmangus ), Colorwheel Media Consulting ( http://www.colorwheelconsulting.com )

Brendan Mangus, YEC

4. Think International

App developers have set their benchmarks on the U.S. market, forgetting how quickly Asia, South America and Europe are booming in the mobile space. Create apps that can go global and provide value in more than just one language.

Grant Gordon ( https://twitter.com/grantagordon ), Solomon Consulting Group ( http://www.solomonbi.com )

Grant Gordon of Solomonbi

5. Launch in Test Markets

Launch your app in test markets first. So much of gaining traction in the app store comes down to either being featured or being a top 25 app. The best way to game the system is to test your app out in small regional markets before you launch in the U.S. Work out the bugs and figure out what drives downloads. Don’t launch too early in the U.S.

Adam Lieb ( http://www.twitter.com/adamslieb ), Duxter ( http://www.duxter.com )

Commentator at CitizenTEKK


6. Solve Real-World Problems and Stay Committed Through the Iterations

The app market is indeed saturated. However, most of the apps are poorly built. This is the result of hopefuls building apps just to build one, and this mindset is generally wrong for an entrepreneur. Focus on solving real-world problems you are passionate about. Remember that startups and app development go through iterations. You will not always get it right the first time. Stay committed.

Gideon Kimbrell ( http://twitter.com/gideonkimbrell ), CLUBSCORE, INC ( http://www.clubscore.com )


7. Solve One Problem Extremely Well

Too many app builders try to solve too many problems at the same time. It’s not about how many features your app has; it’s about how well you’ve been able to perfect the one your app was built for in the first place. Build a clean, beautiful app that executes its main job extremely well. Once you deliver a great user experience, you are already ahead of 90 percent of the competition.

Juha Liikala ( http://www.twitter.com/juhaliikala ), Stripped Bare Media ( http://www.strippedbaremedia.com )

CitizenTEKK hosts discussion from YEC


8. Ensure a Strong PR Launch

When you launch a new app, make sure you make a splash in the media. That requires a significant amount of legwork prior to launching your app. You don’t want to have to pitch a story to media outlets about a product that has been out for months already. Hit the ground running by preparing customized media pitches for specific journalists well in advance of the launch.

Chuck Cohn ( http://twitter.com/chuckcohn ), Varsity Tutors ( http://www.varsitytutors.com )

Chuck Cohn from YEC


9. Research Trends

App developers should invest a lot of attention in trending technologies, particularly geo-targeted push notifications, cloud/Dropbox integration, social media sharing options, easy transactional features and light battery usage. Although some trends turn out to be just fads, these user-friendly developments are already showing strong staying power.

Phil Laboon ( http://twitter.com/#!/eyeflow ), Clear Sky SEO ( http://www.clearskyseo.com/ )

YEC entrepreneurs

1346

Anatomy of a Competitive Analysis

While a competitive analysis should be a core part of a business plan for any organization — big or small — it holds a particular significance to startups and small businesses. By obtaining this type of insight into the specific channels of opportunity in your market, you can ensure that you’re focusing your efforts in the most effective way when budgets are small and resources are limited.


If you haven’t performed a competitive analysis for your business yet, you’re likely missing out on a high potential marketing opportunity. Simple as that.


A competitive analysis should cover seven key topics – and possibly more, depending on your specific goals and market:


  1. Your company’s competitors
  2. Competitor product summaries
  3. Competitor strategies and objectives
  4. Competitor strengths and weaknesses
  5. Market outlook
  6. A SWOT analysis
  7. Future strategy recommendations

Let’s take a close look at these one-by-one.


1. Competitor List


The analysis begins with a list of your company’s competitors, and a quick overview. Pick 4 or 5 that are either comparable to you in stature or are leading brands in the industry.


Consider, also, that there should be an eclectic nature of this list. – These may be competitors from a revenue, brand popularity or online visibility position. Plus, there will, undoubtedly, be additions to this list as your research begins.


2. Competitor Product Summary


Assess your own and your competitor’s products and services in terms of features, value and targets. Customer feedback will be key and can be obtained through surveys, reviews and online research. Get on the phone and talk to your current customers or come up with a set list of questions to send out via email.


Be a prospective customer of your competitors and find out more about their sales process, their funnel and have a clear picture of their products and features.


Finally, find out how your competitor’s manufacturer distribute and market their products. This should give you a basic understanding of what they do differently in comparison to you and each other.


3. Competitor Strategies and Objectives


Observe how your competitors market themselves, and take a look at their public reports to see if you can garner insights into what their current goals and strategies are.


Sales personnel can help you get this sort of information, which is why playing the role as a prospective customer can be key. Former employees and customers may also be able to help.


4. Competitor Strengths and Weaknesses


Here’s where we can really find the opportunity. What’s working well for your competitors? What isn’t? Why not? Where is there room for improvement, and what are the market needs that are not currently being met?


Take a look at this from several angles – the product, the sales process, customer service and, most importantly, their marketing. Analyze their website, social channels and where they’re spending their marketing dollars. Use readily available tools to perform a thorough SEO, SEM and paid advertising analysis.


If one form of marketing simply isn’t working for your competitors, it’s likely that it probably won’t work for you either. Finding that out sooner rather than later will save you time and money. At the same time, with so many marketing channels available these days, there’s sure to be an opportunity that your competitors are all missing out on that could be a perfect location for you to gain traction.


5. Market Outlook


Take a bit of time to also weigh up the overall outlook of your market. All of your competitor research could be for nothing if your particular niche is about to tank, perhaps for socio-economic reasons outside of your control.


How does the market overall look? Is it growing? Is it struggling? How does the economy and consumer behavior look like it will impact the market in the future?


Discover key demographics in your space, and which marketing opportunities best allow you to reach this market. Is there a section of your target audience that offers high potential ROI, or is it a packed market that you’ll always be facing tough competition in?


6. SWOT Analysis


Using all the information you’ve gathered in the steps above, you’re now in a great position to perform your SWOT analysis. This is a structured planning method used to evaluate the Strengths, Weaknesses, Opportunities, and Threats for your business.


Where can you win, and where can’t you win? Which efforts should you capitalize on, and which should you sideline? What are potential future risks?


7. Future Strategy Recommendations


You might be an employee providing these recommendations to a manager or a consultant offering these to a client. Either way, this is where you take your research and turn it into a set of recommendations. These recommendations should then be used to create a formal strategy.


Writing a competitive analysis is both challenging and time-consuming, no doubt about it. But it’s incredibly valuable. You’ll learn a lot about your industry and your company, as well as your competitors, and such a report will become vital for your company in future strategy and planning.

238

Marketing Hacks Using Google+

In this post, I am not going to discuss about the social networking aspects of Google+ at all, but I want to share how small and large businesses can gain immensely from Google+.


Google+ came to being with much fanfare and with speculations to kill Facebook, but it ended up becoming a big ghost town! Over time Google has looked into much deeper integrations of its current products with Google+ and this is a trend which is going to continue in future. It is this integration that you can leverage very strongly by simple use of Google+.


Get more from emails!


60% of people who own an email account have a Gmail account. In October 2012, Gmail surpassed Hotmail to become largest Email Service Provider. What’s more, 5 million businesses use Gmail for their official emails through Google Apps.


There are some neat ways that Google+ is integrated with Gmail, and now you can use it to your advantage.


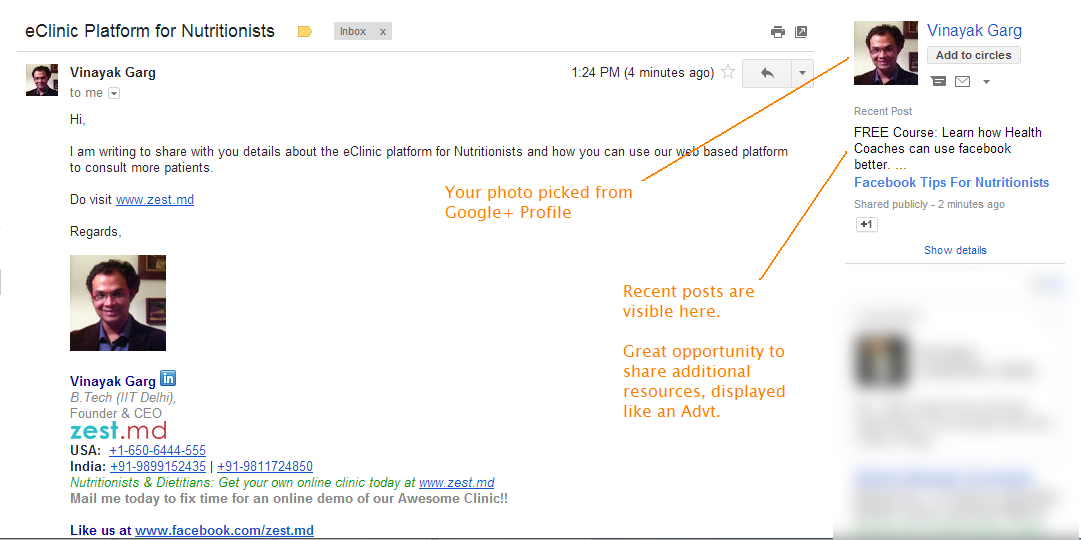
I sent a test mail from my official id to my personal id, and see how it looks on web:


vin1


There are two specific ways you can benefit:


1. Your profile photo: Human photographs increase responses. You might have heard and read a lot about it from website designers and A/B testers – and it’s true for emails too! If you have a profile photo in your Google+ account, your photo would be displayed alongside the email. This gives the reader a sense of connect and familiarity with you.


2. Recent Updates: I see this as a free advertisement I get to place right next to the person reading my email. It is a great way to send additional information to users, something which might not have been suitable to include in the email. It could be the latest customer testimonial, your white paper, your discount offer etc. Try this consistently, and you will see results.


And here is how typically an updates folder looks at one of my client’s mobile, who gets emails from me and others:


Now which are the emails which would catch your attention if you are browsing through emails on mobile?


vin2


In short, if you are emailing your customers or clients, spend just 10 minutes a week to get the right post for the upcoming week on Google+!


Get more from Search!


I don’t think I need to convince you about the dominance of Google’s search engine and the importance of getting more clicks from search results.


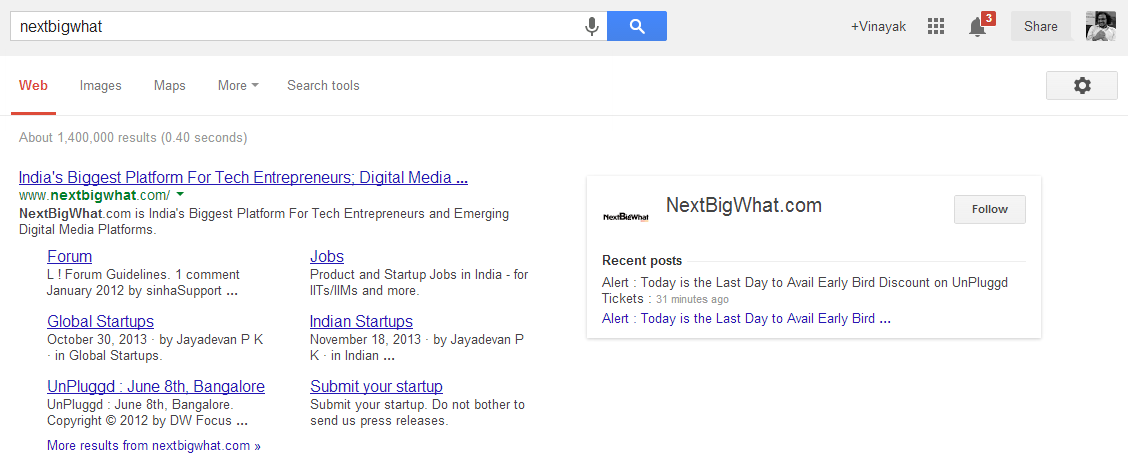
Now see this search result, which story stands out?


vin3


Even though you might not have the first rank for a search term, you can still stand out and get more traffic from searches. The photo here is picked from your Google+ profile, and you need to “Verify Authorship” for this to happen. (Read how to do it here: https://plus.google.com/authorship)


There is another way you can use search to standout from the rest. Your business page on Google+ is also shown alongside the search, and just like in emails, you get to showcase your recent posts here. See some examples below:


vin4

vin5

For this to work you need to complete your Business Page on Google+ and keep it updated. (Note: This is a Business page on Google+ and not Google Local Business Listing. Google Business Listings and Google+ is currently undergoing deeper integrations, and it may change in future). With a clever update you can gain a lot.


Lastly, add the +1 button to your page. It’s okay to be shameless and get your friends to click on it. The  +1 button sends social signals, which are embedded much more widely in the search results/ While I can’t pinpoint the exact effect, one thing that is sure is that it doesn’t hurt to get +1.


vin6

When I search, Google shows my other friends who +1 the website as well.


I hope you try these hacks and have a greater impact from your existing efforts of marketing. Do you have any inputs, comments, or questions? Do share in the comments below.

543

Holiday Shopping Smackdown: Black Friday Vs. Cyber Monday

Forget the turkey — Thanksgiving and the days after it are all about shopping. In 2012, more than 307 million people headed to stores on Black Friday, according to ShopperTrak.


Forbes reported 35 million people took a break from football and eating on Thanksgiving Day itself to do some in-person and online shopping in 2012. Over the weekend, another 247 million people headed to stores. Whether you shop on Black Friday or hold out for the deals on Cyber Monday depends on your shopping preferences and willingness to hold out for a better deal.


Excitement vs. Comfort


Queuing up in front of the doors to the mall or a big box store can be pretty exciting. In 2011, Time reported that a couple decided to camp outside of their local Best Buy for nearly two weeks to be first in line when doors opened Friday morning. But all that excitement can quickly turn to fear. The stampede of shoppers into the store once the doors open on Black Friday has led to injuries and even deaths, according to US News and World Report.


If spending days or even hours sitting outside doesn’t appeal to you, Cyber Monday offers some comfort. According to SOASTA, 31 percent of shoppers in 2012 stated that they would rather shop online because the deals and excitement of Black Friday “bring out the crazy” in other shoppers. People talking about Cyber Monday in 2012 were more likely to be excited or happy about it, compared to those who reported feeling excitement but also impatience about Black Friday, according to SAP.


The Deal Hunt


Finding good Black Friday deals and deals on Cyber Monday is part of the thrill of holiday shopping. A number of retailers, including JC Penney, Target and Amazon let people sign up months in advance to be notified of deals via email. As the number of deals offered on Cyber Monday now closely rivals those available on Black Friday, according to CNBC, it can be a toss-up for consumers when they decide to shop. In 2012, Time noted that people could save 5 percent if they waited until after Black Friday and Cyber Monday to buy a television or camera.


Blurred Lines


The difference between Black Friday and Cyber Monday is becoming less and less apparent as technology develops. The use of smartphones and other mobile devices means that shoppers can comparison shop online while in a physical store. Forbes reported that people used comparison shopping apps such as ShopSavvy and RedLaser when shopping and that mobile devices funneled 25 percent of online shopping traffic on Black Friday.


Online deals aren’t limited to Cyber Monday anymore, either. In 2012, up to a quarter Cyber Monday deals were expected to kick off on Friday. The year before, the deals started on Saturday, according to CNBC.


Nor is Black Friday limited to Friday anymore. Plenty of stores, such as WalMart and Target, opened their doors on Thanksgiving night, eliminating the need for shoppers to get up at 2 or 3 in the morning to get to the store by 4 or 5 am. Some of the Black Friday Thanksgiving deals were also online, further blurring the distinction between the traditionally in-store Black Friday and the traditionally online Cyber Monday.

1063

Facebook’s vs Twitter’s Approach to Real-Time Analytics

Last year, Twitter and Facebook have released new versions of their real-time analytics systems.


In both cases, the motivation was relatively similar — they wanted to provide their customers with better insights on the performance and effectiveness of their marketing activities. Facebook’s measurement includes “likes” and “comments” to monitor interactions. For Twitter, the measurement is based on the effectiveness of a given tweet – typically called “Reach” – basically a measure of the number of followers that were exposed to the tweet. Beyond the initial exposure, you often want to measure the number of clicks on that tweet, which indicate the number of users who saw the tweet and also looked into its content.


Facebook’s vs Twitter’s Approach to real-time Analytics


Facebook Real-Time Analytics Architecture – Logging-Centric Approach:


  • Relies on Apache Hadoop framework for real-time and batch (map/reduce) processing. Using the same underlying system simplifies the maintenance of that system.


  • Limited real-time processing — the logging-centric approach basically delegates most of the heavy lifting to the backend system. Performing even a fairly simple correlation beyond simple counting isn’t a trivial task.


  • real-time is often measured in tens of seconds. In many analytics system, this order of magnitude is often more than enough to express a real-time view of what is going on in your system.


  • It is suitable for simple processing. Because of the logging nature of the Facebook architecture, most of the heavy lifting of processing cannot be done in real-time and is often pushed into the backend system.


  • Low parallelization — Hadoop systems do not give you ways to ensure ordering and consistency based on the data. Because of that, Facebook came up with their Puma service that collects and inputs data into a centralized service, thus making it easier to processes events in order.


  • Facebook collects user click streams from your Facebook wall through an Ajax listener which, then, sends those events back into the Facebook data centers. The info is stored on Hadoop File System via Scribe and collected by PTail.


  • Puma aggregates logs in-memory, batching them in windows of 1.5 seconds and stores the information in Hbase.


  • The Facebook approach puts a huge limit as to the volume of events that the system can handle and have significant implications over the utilization of the overall system.


Twitter Real-Time Analytics Architecture – Event-Driven Approach:


  • Unlike Facebook, Twitter uses Hadoop for batch processing and Storm for real-time processing. Storm was designed to perform fairly complex aggregation of the data that comes through the stream as it flows into the system, before it is sent back to the batch system for further analysis.


  • Real-time can be measured in milliseconds. While having second or millisecond latency is not crucial to the end user — it does have a significant effect on the overall processing time and the level of analysis that we can produce and push through the system. As many of those analyses involve thousands of operations to get to the actual result.


  • It is suitable for complex processing. With Storm, it is possible to perform a large range of complex aggregation while the data flows through the system. This has a significant impact on the complexity of the processing. A good example is calculating trending words. With the event-driven approach, we can assume that we have the current state and just make the change to that state to update the list of trending words. In contrast, a batch system will have to read the entire set of words, re-calculate, and re-order the words for every update. This is why those operations are often done in long batches.


  • Extremely parallel - Asynchronous events are, by definition, easier to parallelize. Storm was designed for extreme parallelization. Ultimately, it determines the speed level of utilization that we can get per machine in our system. Looking at the bigger picture, this quite substantially adds to the cost of our system and to our ability to perform complex analyses.

Final Words


Quite often, we get caught in the technical details of these discussions and lose sight of what this all really means.


If all you are looking for is to collect data streams and simply update counters, then both approaches would work. The main difference between the two is felt in the level and complexity of processing that you would like to process in real-time. If you want to continuously update a different form of sorted lists or indexes, you’ll find that doing so in an event-driven approach, as is the case of Twitter, can be exponentially faster and more efficient than the logging-centric approach. To put some numbers behind that, Twitter reported that calculating the reach without Storm took 2 hours whereas Storm could do the same in less than a second.


Such a difference in speed and utilization have a direct correlation with the business bottom line, as it determines the level and depth of intelligence that it can run against its data. It also determines the cost of running the analytics systems and, in some cases, the availability of those systems. When the processing is slower there would be larger number of scenarios that could saturate the system.


References:

728